Guam Alert Hub
Built for a live storm. Used by thousands within 48 hours.
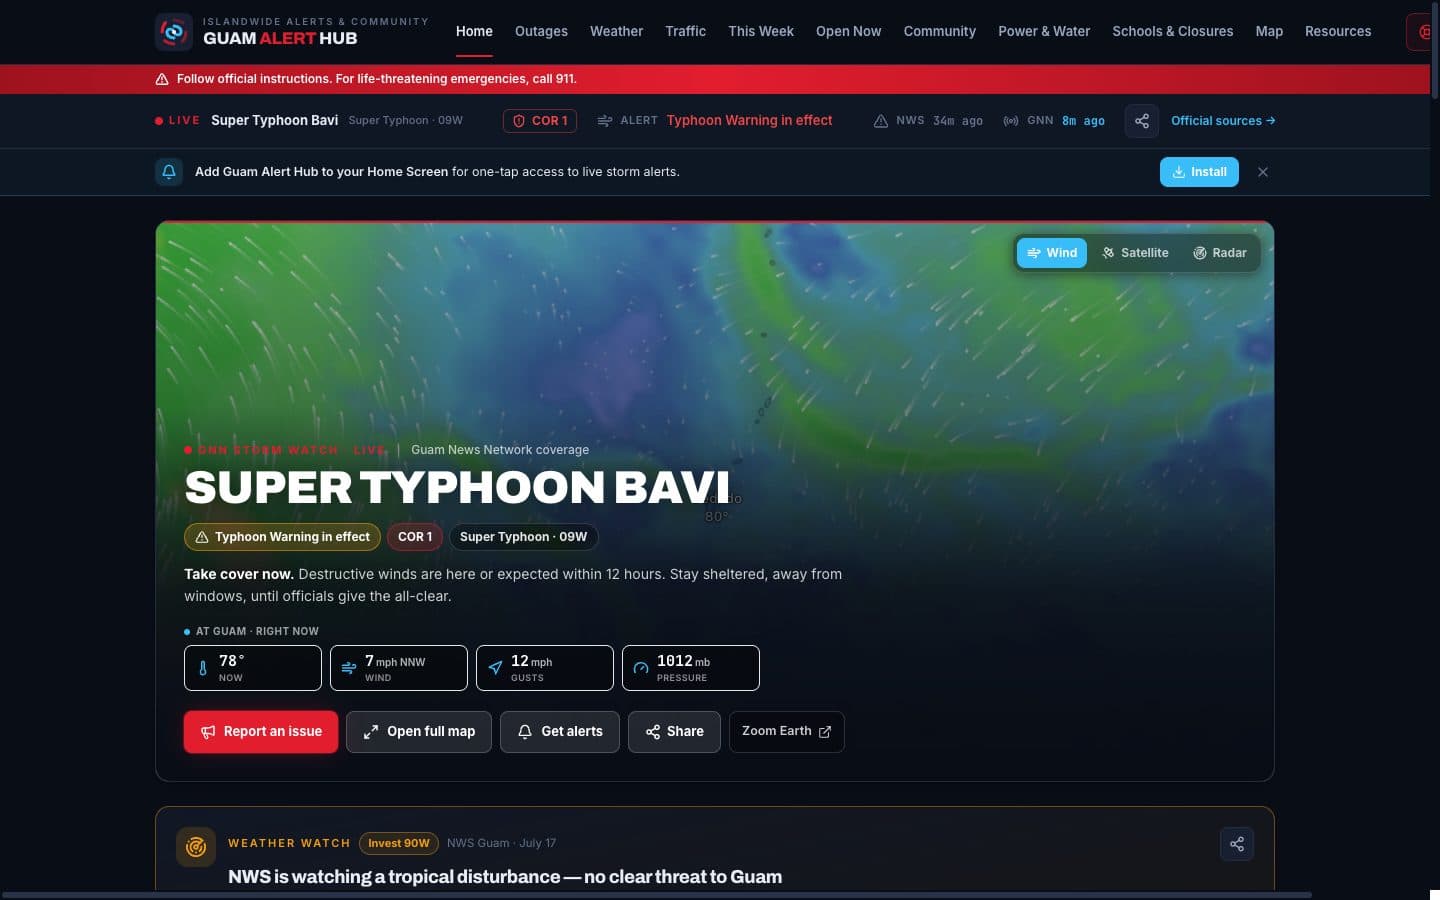
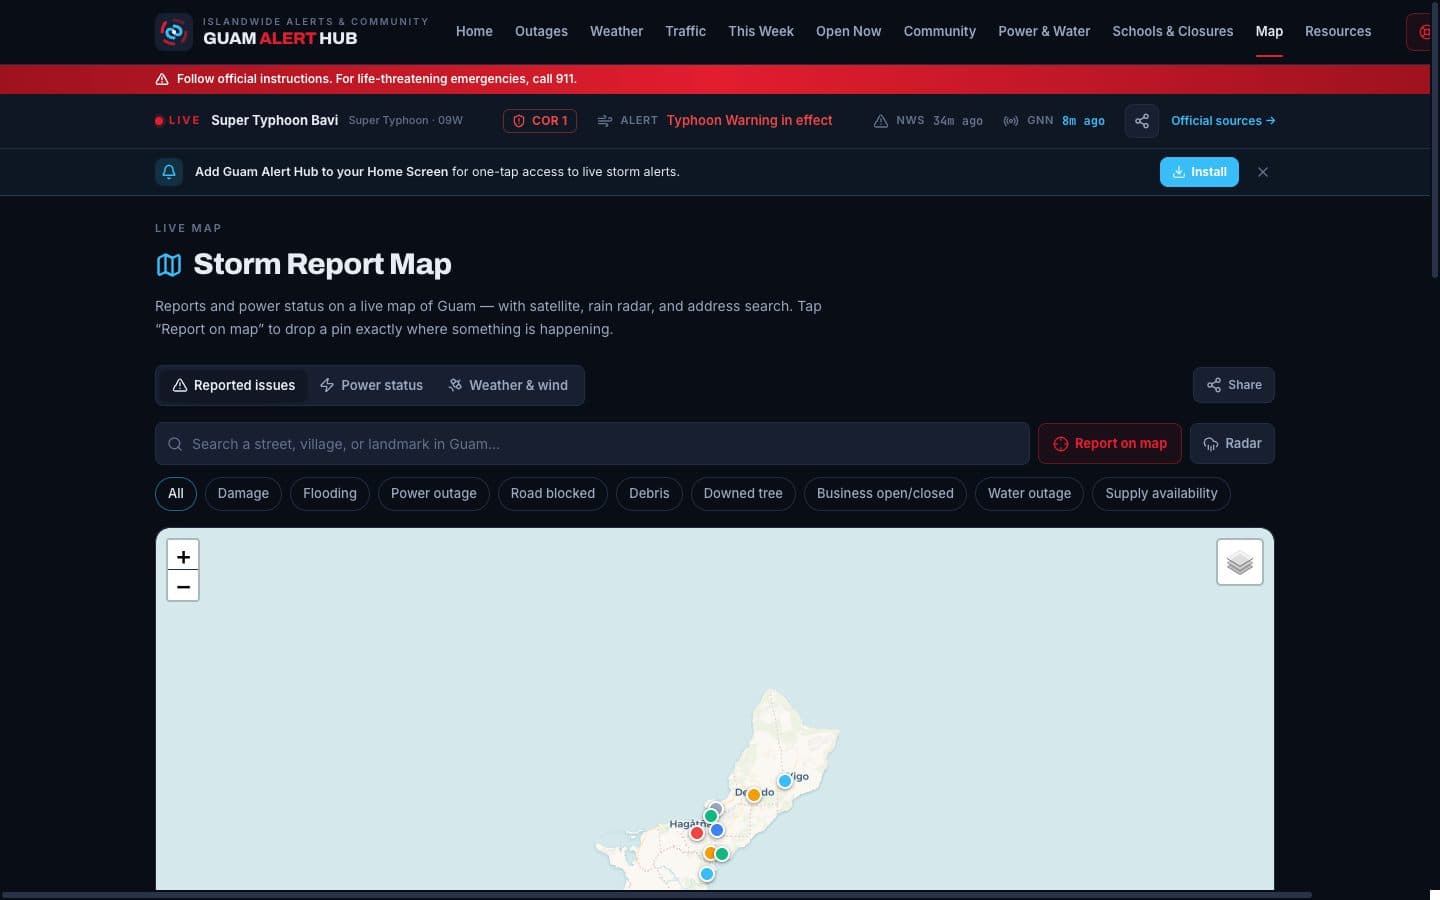
A year-round emergency information and community reporting platform for Guam. It pulls National Weather Service alerts and local agency advisories into one severity-ranked feed, and lets residents report outages, road conditions, and damage from their own villages.
The problem
During a storm, Guam's official information is scattered across agency Facebook pages, radio, and separate utility sites. Residents refresh five sources to answer one question: what is happening near my house right now?
The system
One mobile-first platform that aggregates official alerts, scrapes agency advisories, and adds the missing layer: structured, geolocated reports from residents themselves, verified and moderated before they mislead anyone.
Verified numbers
- 3,216
- Visitors
- 15,374
- Page views
- 182
- Community reports
- 4.8
- Pages per visitor
- $0
- Advertising spend
~48 hours of live storm activity
structured, village-tagged
Only independently supportable figures appear here.
What happened
- Launched into Super Typhoon Bavi (July 2026) and became a live outage map for the island within 48 hours
- Residents filed structured reports across Guam's villages; 86% documented power outages, concentrated where the island actually went dark
- Spread entirely by word of mouth across Facebook, Instagram, and Reddit
Dormant until it mattered, then vertical
For days after launch the site sat quiet. The moment Bavi became a threat, residents arrived en masse: near-zero activity through July 3, a sharp inflection on July 4 as the storm approached, a peak on July 5, tapering through July 7.
That is the signature of real utility: a tool people don't think about until they need it, then reach for instinctively.
They came to act
The live map and community reports pages each drew as many visitors as the homepage. People weren't skimming headlines. They were checking conditions and contributing. Nearly five page views per visitor is deep engagement for a news-adjacent site.
| Page | Visitors |
|---|---|
| Home | 2,300 |
| Live Map | 1,200 |
| Community Reports | 1,200 |
| What's Open | 623 |
| Help | 267 |
182 reports built a live outage map
Residents generated information as much as they consumed it. 86% of reports documented power outages, concentrated in the north and central villages: a real-time, ground-level picture of where the island went dark, faster than any single official channel published it.
Five villages (Dededo, Yigo, Tamuning, Barrigada, and Mangilao) accounted for 131 of the 182 reports: a heat map of where the island needed attention, drawn by the people living it.
| Category | Reports |
|---|---|
| Power | 157 |
| Roads | 15 |
| Water | 7 |
| Flooding | 2 |
| Damage | 1 |
It spread on its own
Every visitor arrived through word of mouth, shared across Facebook (943 visitors), Instagram (387), Google search (155), and Reddit (137). No paid promotion. Organic spread at this speed is the clearest signal that residents found it worth sharing in the middle of a storm.
Being straight about the limits
This is a ~48-hour snapshot from a single storm, not a sustained-usage record. It proves demand and behavior, not long-term retention.
Community reports are resident-submitted, not official confirmations; GPA, GWA, and the National Weather Service remain the authorities. The platform supplements them; it doesn't replace them.
Reach was social-driven: fast but shallow. Converting one-storm visitors into a returning, prepared audience is the next challenge, and the current focus of development.
Inside the system
- Severity-ranked alert feed (NWS + Guam agency advisories)
- Live storm map with radar and storm track
- Geolocated community reports with village tagging
- “What's open” business status tracker
- FEMA-ready damage documentation
- Admin verification, pinning, and AI-assisted moderation
- Email alert dispatch with one-click unsubscribe
- Phase-aware homepage: Active / Recovery / Calm modes
In the product